Graphic Software for Infographics
White-collar work has become a lot more interesting with infographics taking their place among the everyday tools of market research, product development and visualization of data. From the easiest schematics to state-of-the-art designer solutions, infographics ease the pain of explaining and spreading information in a fun and engaging way.
Let’s dive into the world of good graphics and complicated things explained in an entertaining way with Amadine for Mac, which will make your infographics shine as a jewel in the sea of information.

Create Infographics on Your Mac with Amadine
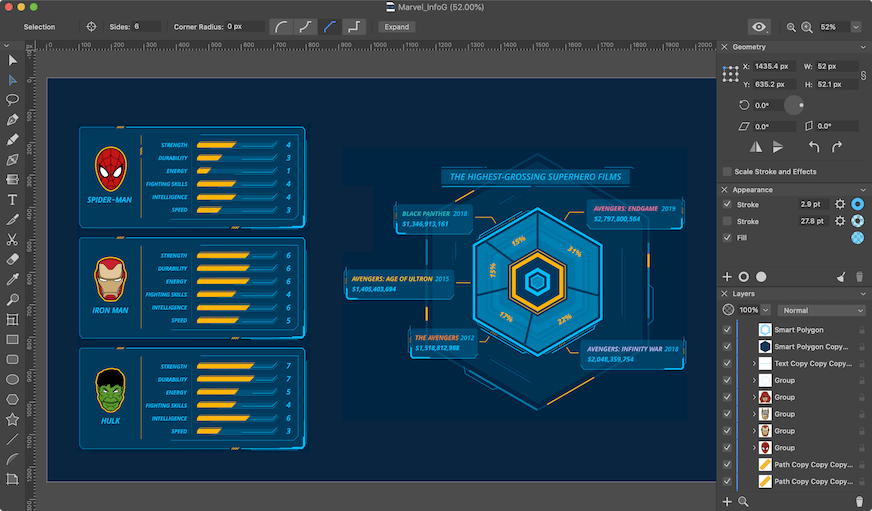
While being very easy to use and practical, Amadine will help solve any designing task that the infographics creator may face. Do you need to represent numerous information in a clear and straightforward way? Amadine allows you to manually create pie charts, bar graphs and line graphs and achieve the precise outcome that you need.

Infographic Basics
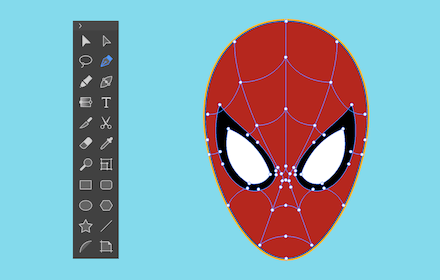
Pen Tool is used for the vast majority of plain 2D graphics, which is the basis for your clear infographics, allowing you to create an icon flat-style to result in a professional slick look for your infographics.

Pie Charts
Never miss out on an opportunity to show off the important numbers of your company in a pie chart. The Elliptic Arc Tool has a sub-tool called the Sector Tool, which is located in the upper Toolbar. Sector Tool is a good choice for pie charts and percentage values.

Bar Graphs
To create a bar graph for displaying the difference among several significatives, use the Rectangle tool.

Custom Charts
Want something with a personalized vibe? Try creating a beautiful hexagonal chart with the Polygon tool. You can select the number of sides that you need since it is a smart object and will retain the chosen number.
Have a look at the feedback from our users who are pleased with Amadine’s performance: